
Every Network Metric Needs an Observation Point
Network diagnostics become misleading when browser-side facts, CDN edge facts, and server-side probe results are shown as if they came from the same place.
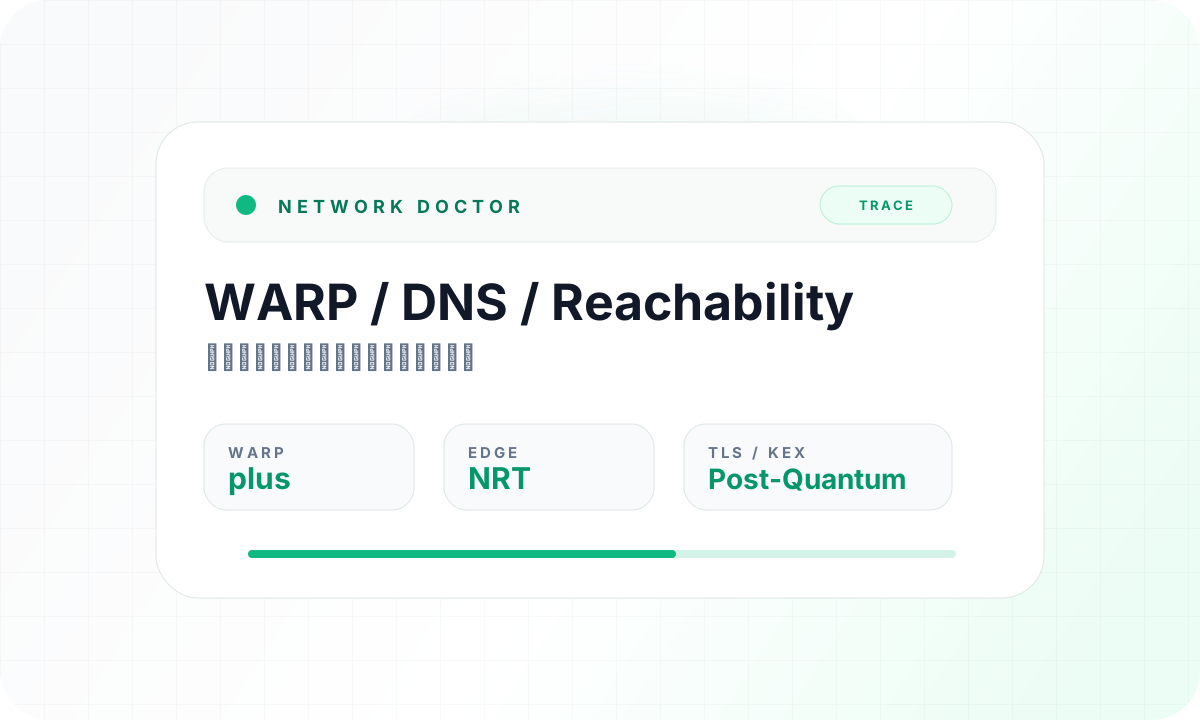
This page is organized as a full read-through, from background to implementation and usage.
A network result is not just a number
Network tools often present results as if they were universal facts:
- latency is 42 ms
- DNS took 80 ms
- the service is reachable
- the user is connected through a certain edge location
Those statements are only meaningful when we know where the measurement was made.
Latency from the user's browser is not the same as latency from a server-side probe. DNS resolver latency from a public DoH endpoint is not the same as the user's local resolver. A Cloudflare edge colo is not the same as the origin region. If a tool hides those distinctions, it can make a correct measurement feel like the wrong answer.
This is why OpsKitPro treats measurement origin as a first-class part of Network Doctor.
Your device, the edge, and the probe
A useful network diagnosis usually combines at least three perspectives.
Your Device is the browser or client running the tool. It can observe local browser APIs, public IP context, WebRTC-like behavior where available, and the user's connection to the public internet.
Cloudflare Edge is the public entry layer for OpsKitPro. It can expose facts such as colo, WARP status, Gateway state, TLS hints, and request metadata through Cloudflare Trace.
OpsKitPro Probe is the server-side diagnostic path. It can perform backend fetches, DNS checks, reachability tests, TLS probes, and API-level checks from the OpsKitPro runtime.
Each perspective is useful. None of them should pretend to be the others.
Why labels prevent false conclusions
Imagine a user in Tokyo opens a network check page. The browser sees a fast connection to a nearby Cloudflare edge. At the same time, an OpsKitPro server-side probe may test a third-party service from its own hosting region. A public DNS latency check may query several public resolvers from the server.
All three results can be true:
- the user's edge connection is healthy
- the third-party service is slow from the probe
- one public resolver is slower than another
But if the UI simply says "network is slow," the result becomes useless. Slow from where? Slow to what? Slow compared with which path?
The label is not decoration. It is part of the data.
The Network Doctor naming change
OpsKitPro previously used wording like "Global Reachability" for a reachability section. That sounded bigger than the measurement really was.
The section was renamed to Service Reachability because the probe checks whether selected services are reachable from the OpsKitPro measurement path. It is still useful, but it is not a promise that every region in the world sees the same result.
This small wording change reflects a larger rule: network diagnostics should avoid overclaiming.
DNS latency is a good example
DNS is especially easy to misread.
If a tool measures latency to public resolvers from the backend, the result can help compare resolver behavior from that backend environment. It does not directly tell the user how fast their home router, corporate DNS, ISP resolver, or browser DNS cache is.
That distinction matters during incidents. A domain may look healthy from public resolvers while a corporate resolver still serves stale records. Or a user's local resolver may be slow while global public resolvers look fine.
The fix is not to hide the result. The fix is to label it honestly.
How this shapes Network Doctor
OpsKitPro Network Doctor is moving toward a model where each section answers two questions:
- What did we observe?
- Where did we observe it from?
That means Cloudflare Trace data should be presented as edge/request context. Browser-side facts should be presented as device context. Server-side checks should be presented as OpsKitPro Probe context.
The resulting page may look slightly more explicit, but it is much safer for real troubleshooting.
Use the result as a map, not a verdict
Open Network Doctor and read each metric with its observation point in mind.
If your device context is healthy but a server-side service check fails, inspect the path between the probe and the target. If Cloudflare Trace shows an unexpected colo or Gateway state, inspect the edge route. If DNS resolver results disagree, look at resolver-specific behavior before blaming the application.
Network diagnostics work best when they act like a map of perspectives, not a single verdict.